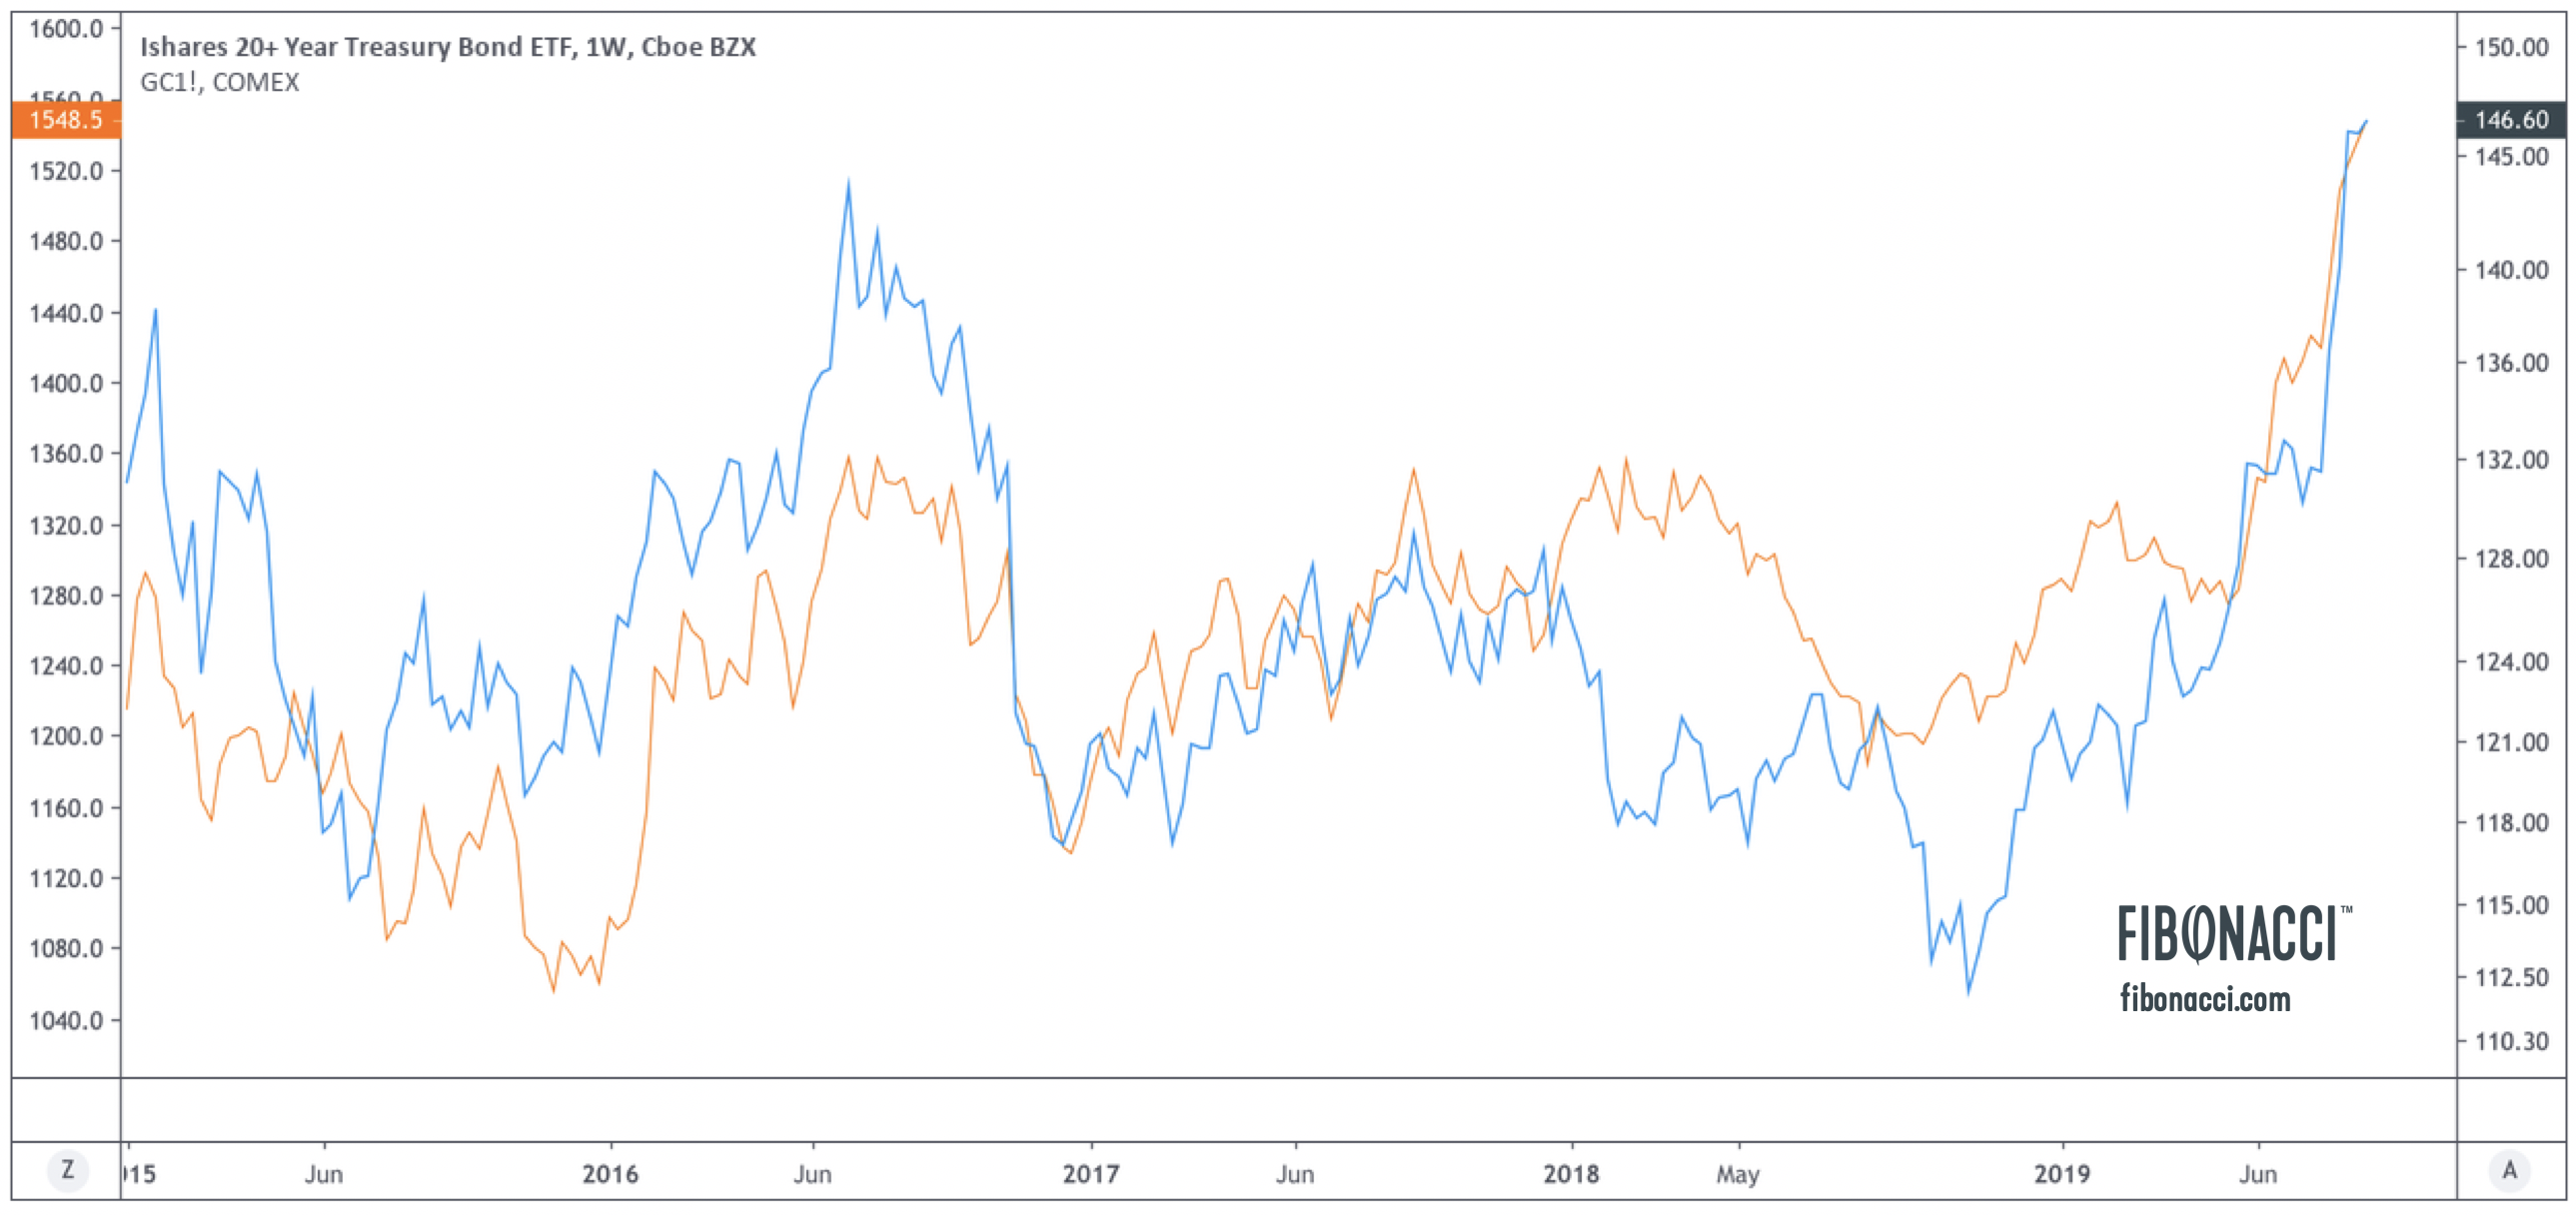
Flight to safety
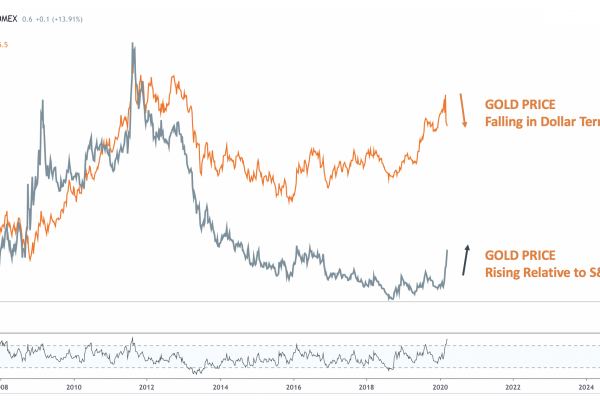
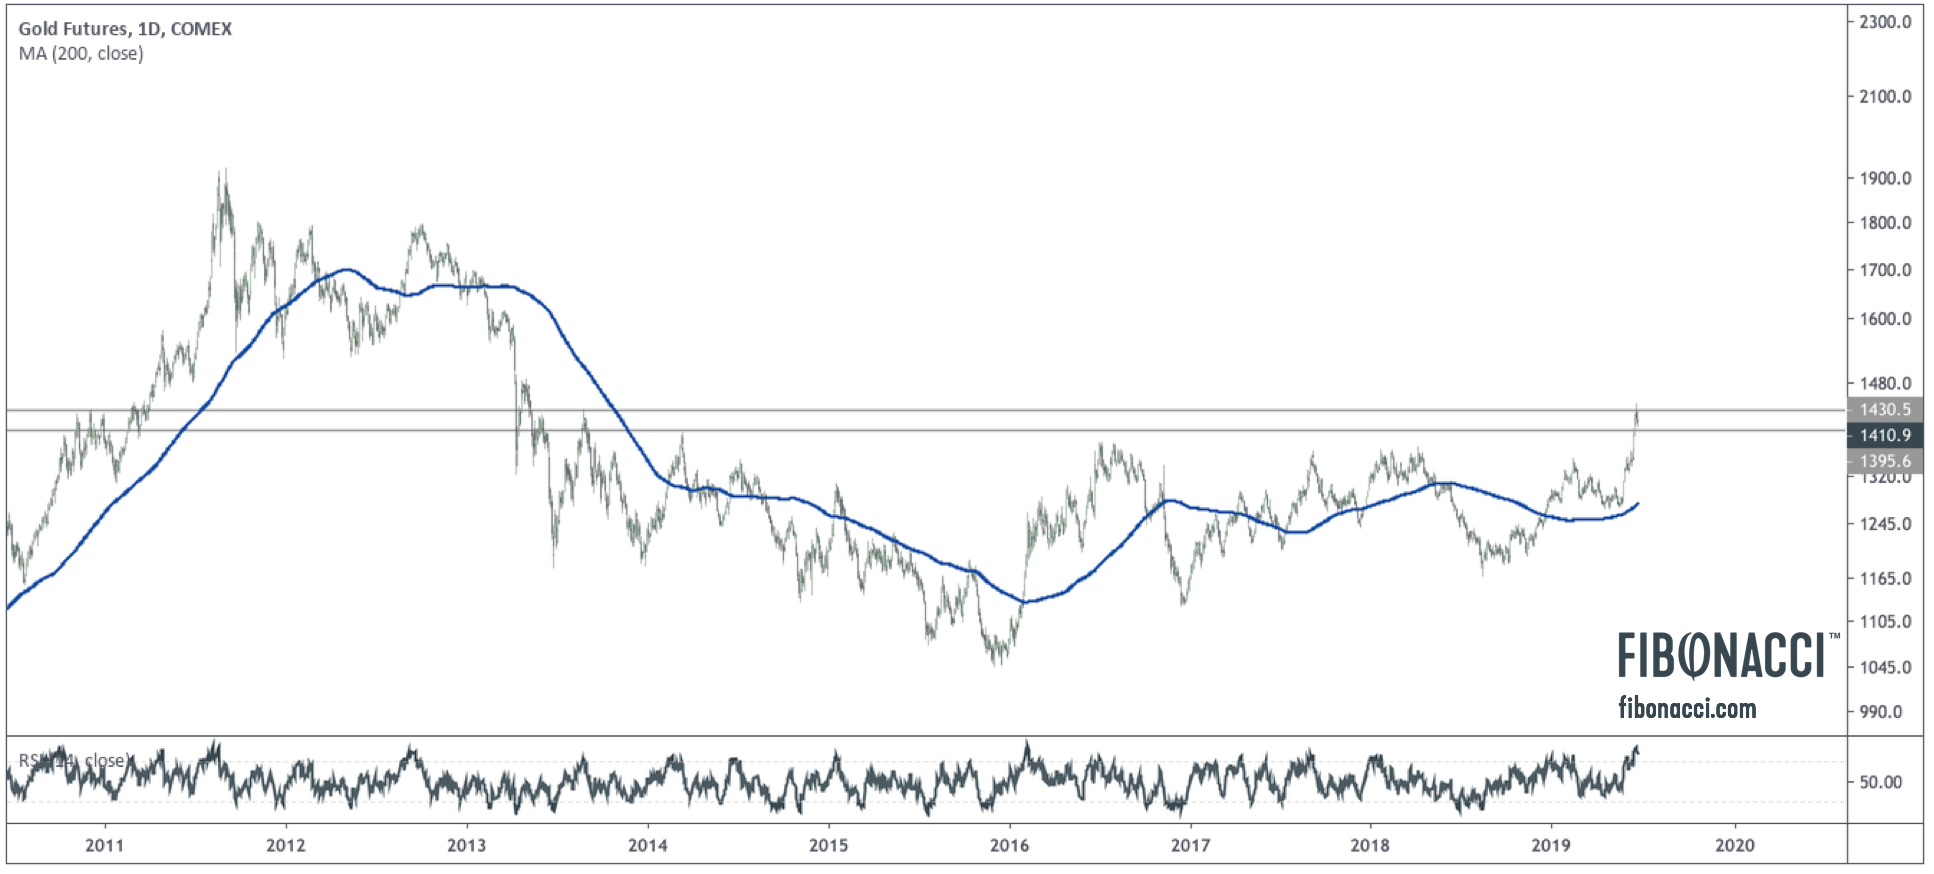
Since 2015, the gold market and bond market (I use the $TLT 20-Year Bond ETF as a proxy for bond market performance) has been highly correlated. Both asset classes are viewed as a risk-off flight to safety. While past performance does not predict future performance, it is worth noting that many are viewing the bond market as a “bubble,” while simultaneously extolling the opinion that gold has entered a long-term secular bull market. I am personally allowing for the possibility that both have much higher long term upside, particularly when considering that US bonds offer the highest yields in the world. The best yielding sovereign bonds should continue to fetch a global bid. (more…)
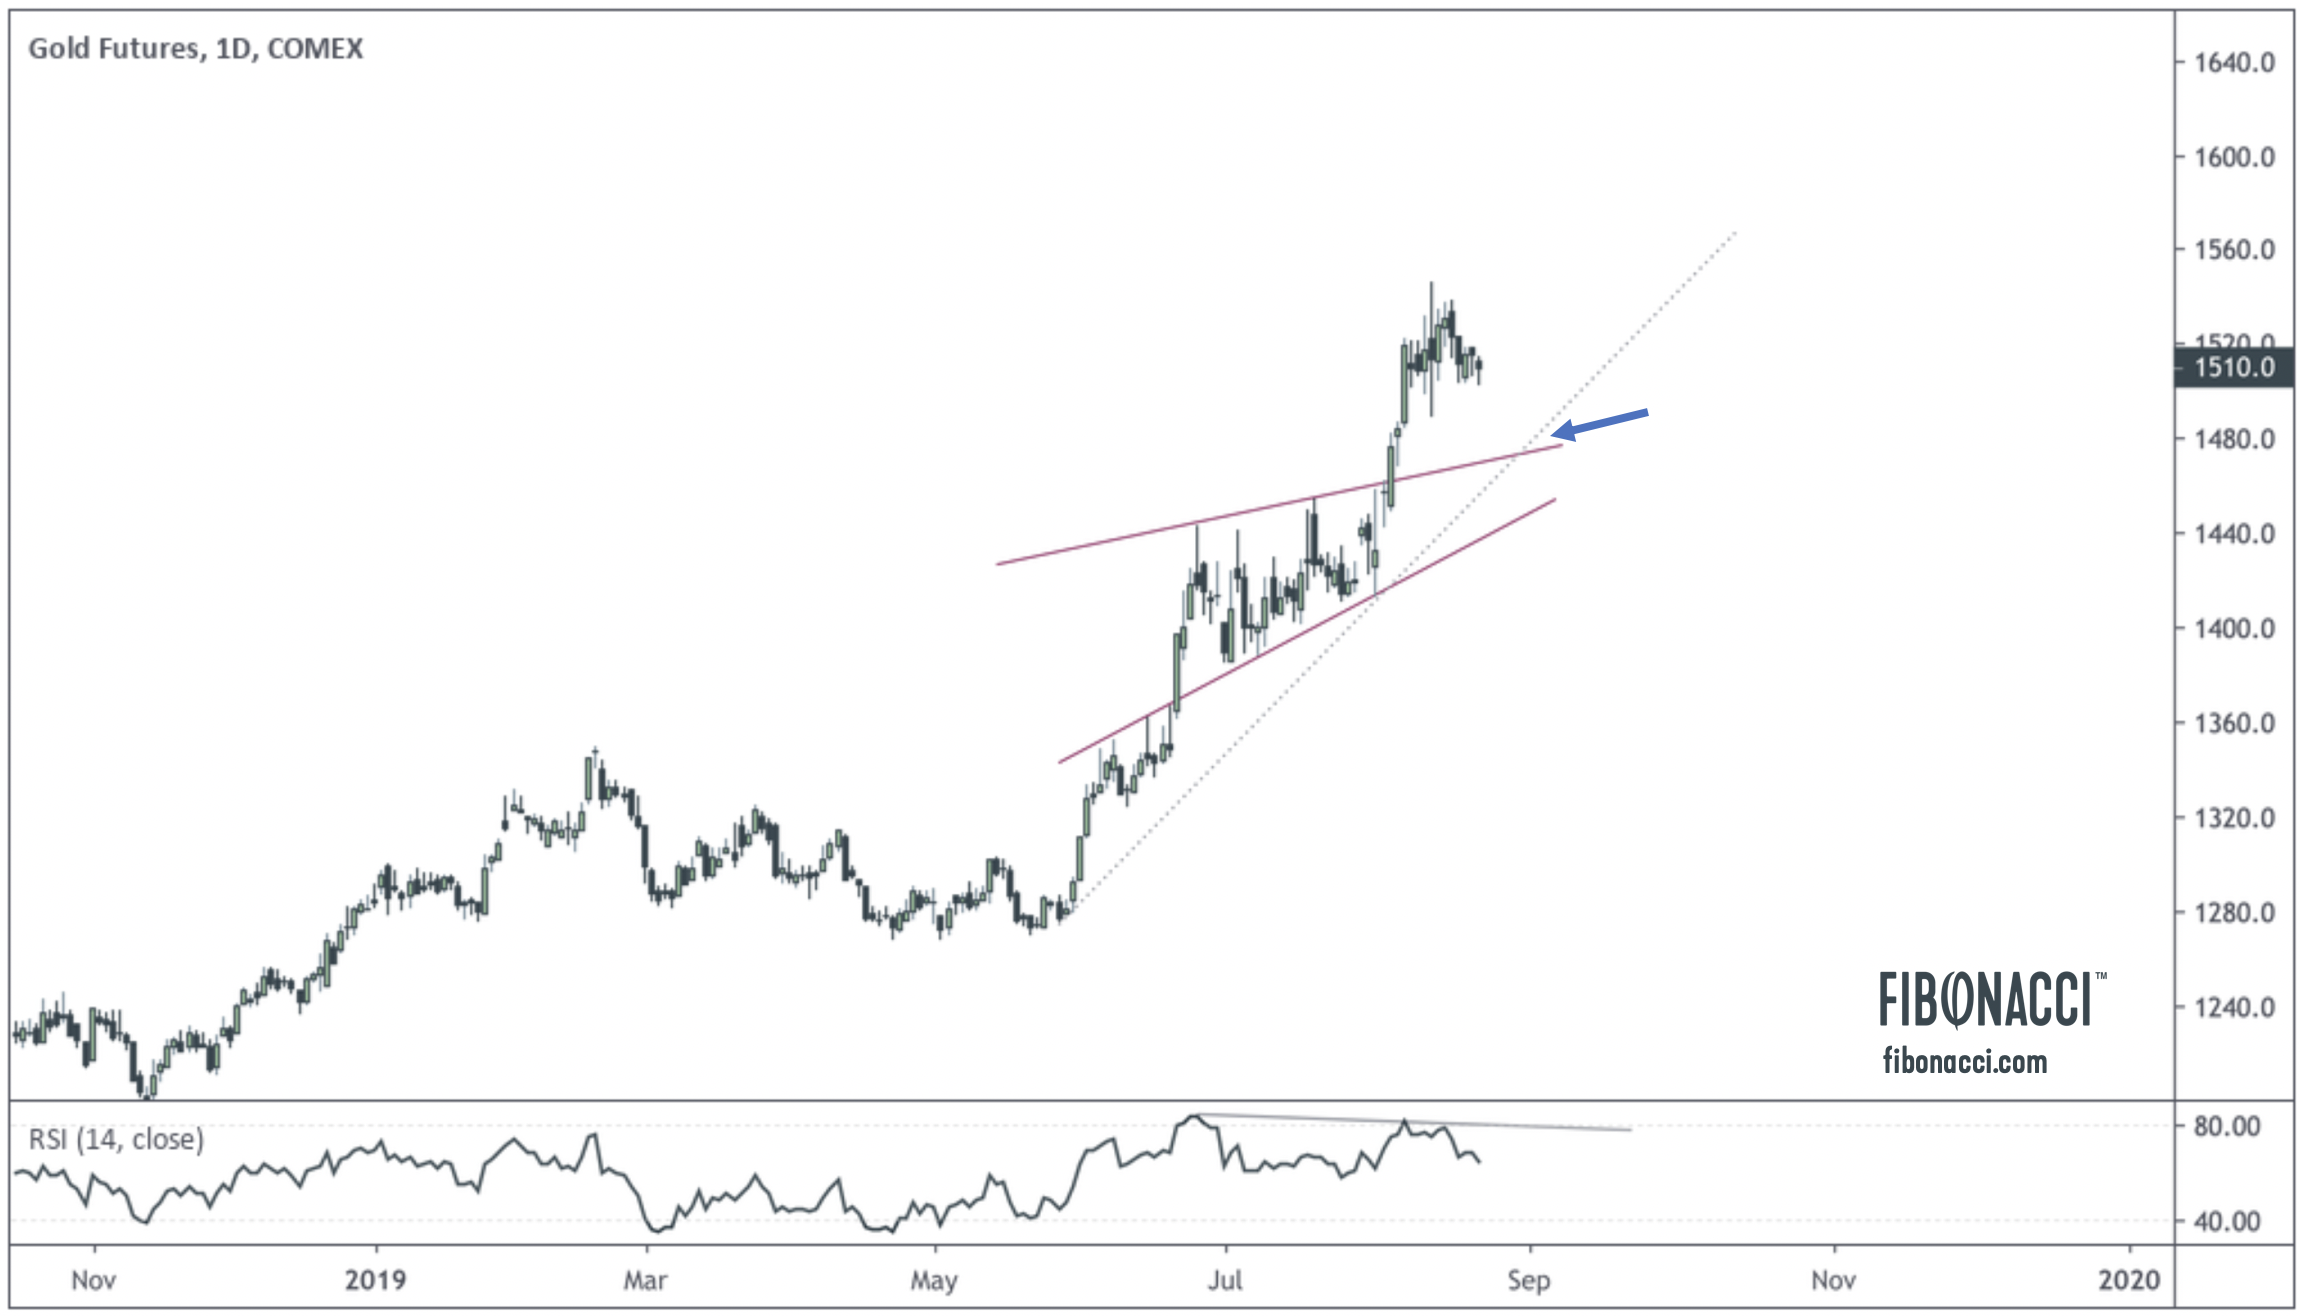
Price a bit overextended
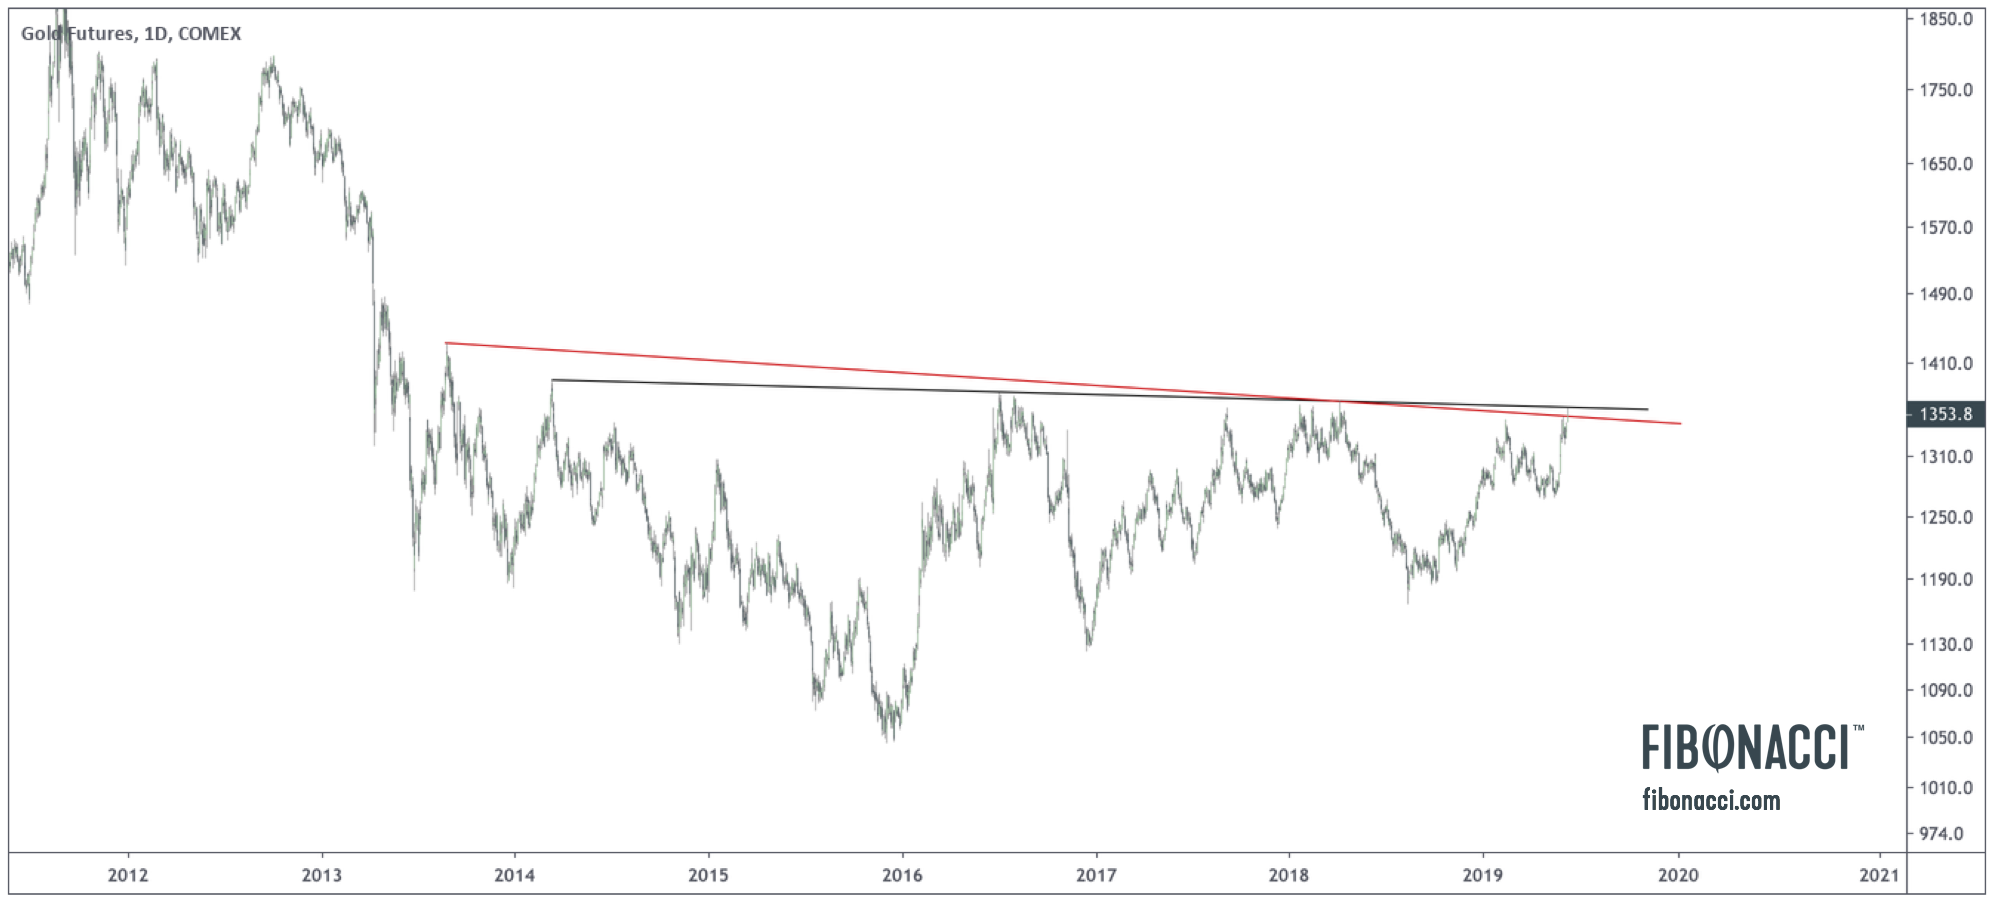
Gold has been on an epic run since early May, breaking out of a six-year base and launching almost $300 per ounce in the span of three months. Momentum favors the bulls, and the technicals look very strong over the long term. The backdrop of lower global yields and potential monetary stimulus are key fundamental drivers for the recent breakout. (more…)

Platinum Testing Downtrend Line With Potential Upside Breakout?
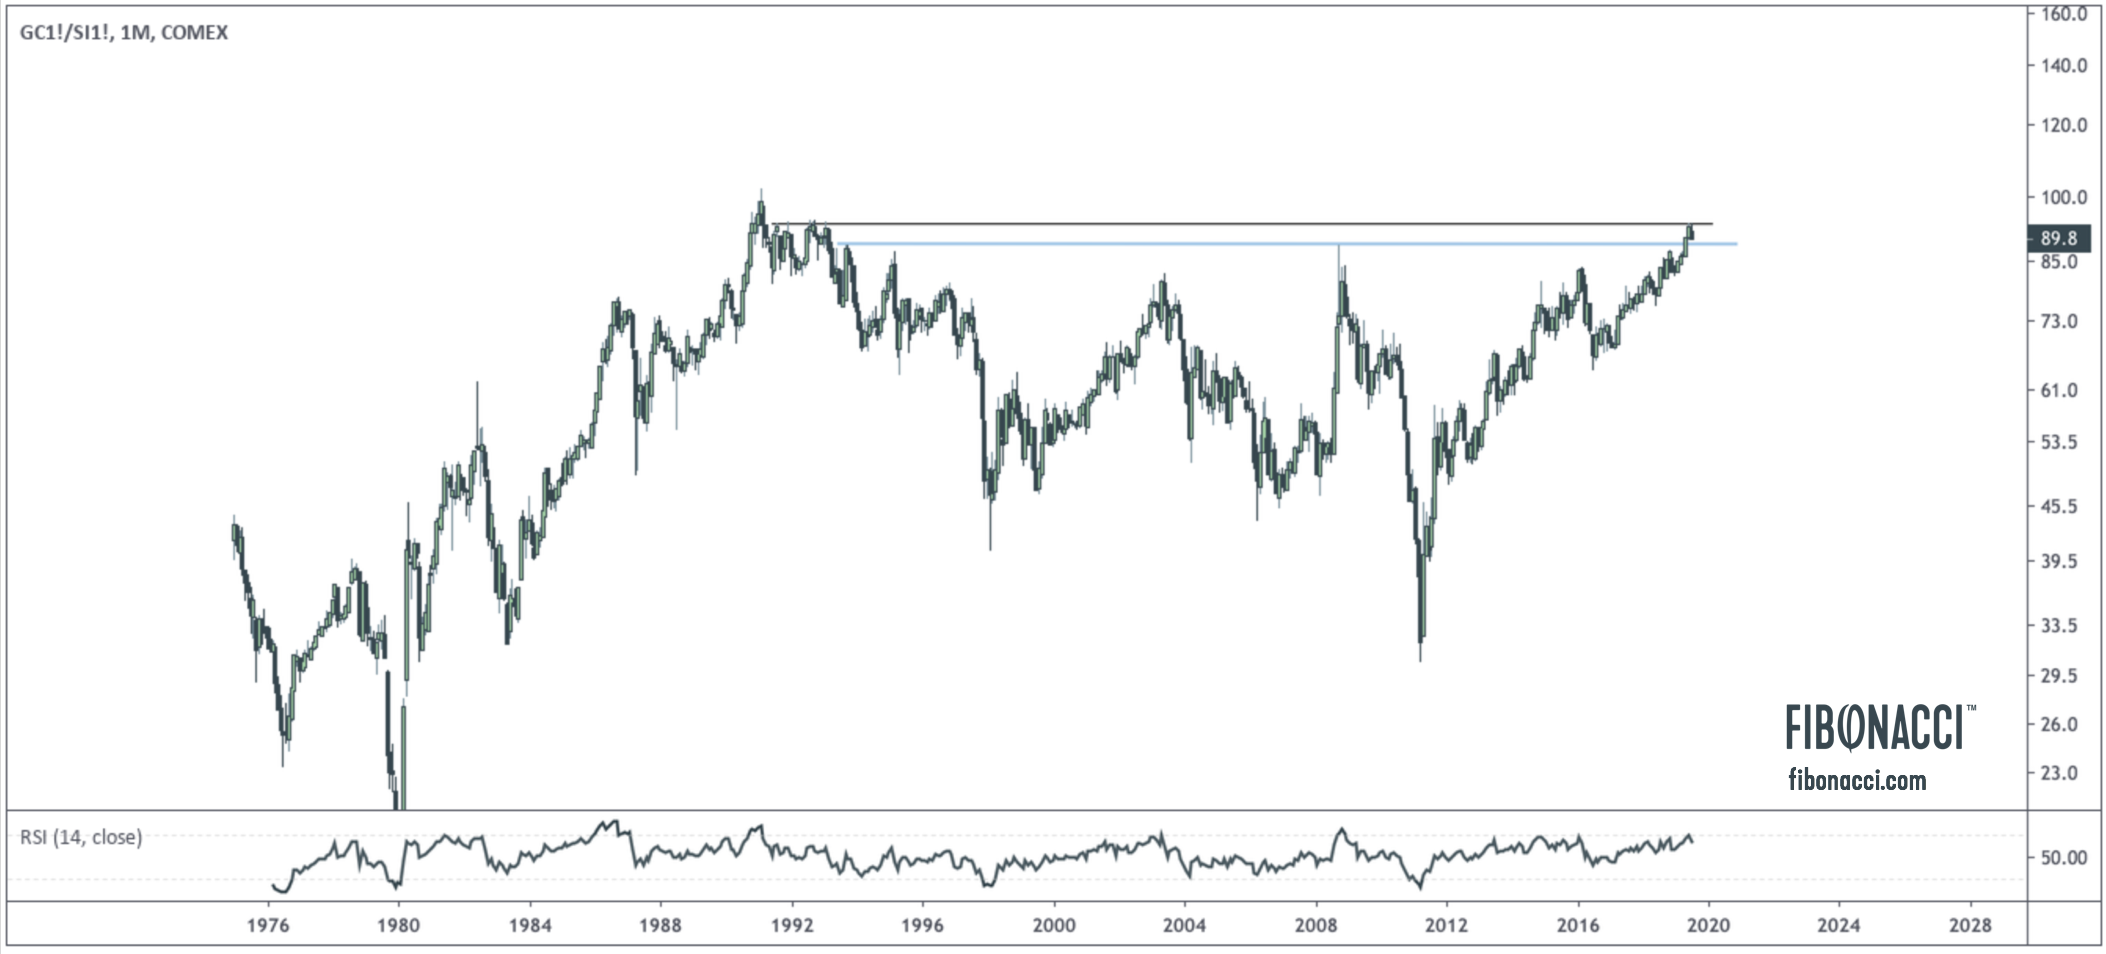
Platinum has underperformed gold since the ratio double bottomed in 2014. This has been especially frustrating for bulls as platinum’s cousin in the PGM group – palladium – has burst to all-time highs through the same period. (more…)
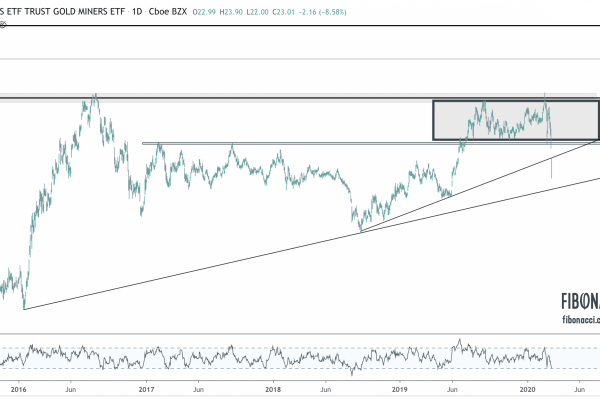
Test of 30-year highs rejected this week
After a quick mid-summer vacation I am finally getting back into the swing of things here. I’d like to kick off a few posts this week by highlighting the move in silver and specifically the gold/silver ratio.
As we have discussed at length in previous posts, the story this summer has been gold breaking out of a six-year base at $1365 and finally showing signs of strength after may false starts. What has made many gold bulls lingering skeptics has been the performance of silver, which is a smaller market with higher beta. Generally, when gold goes up, silver goes up much faster. When gold goes down, silver goes down much faster. (more…)
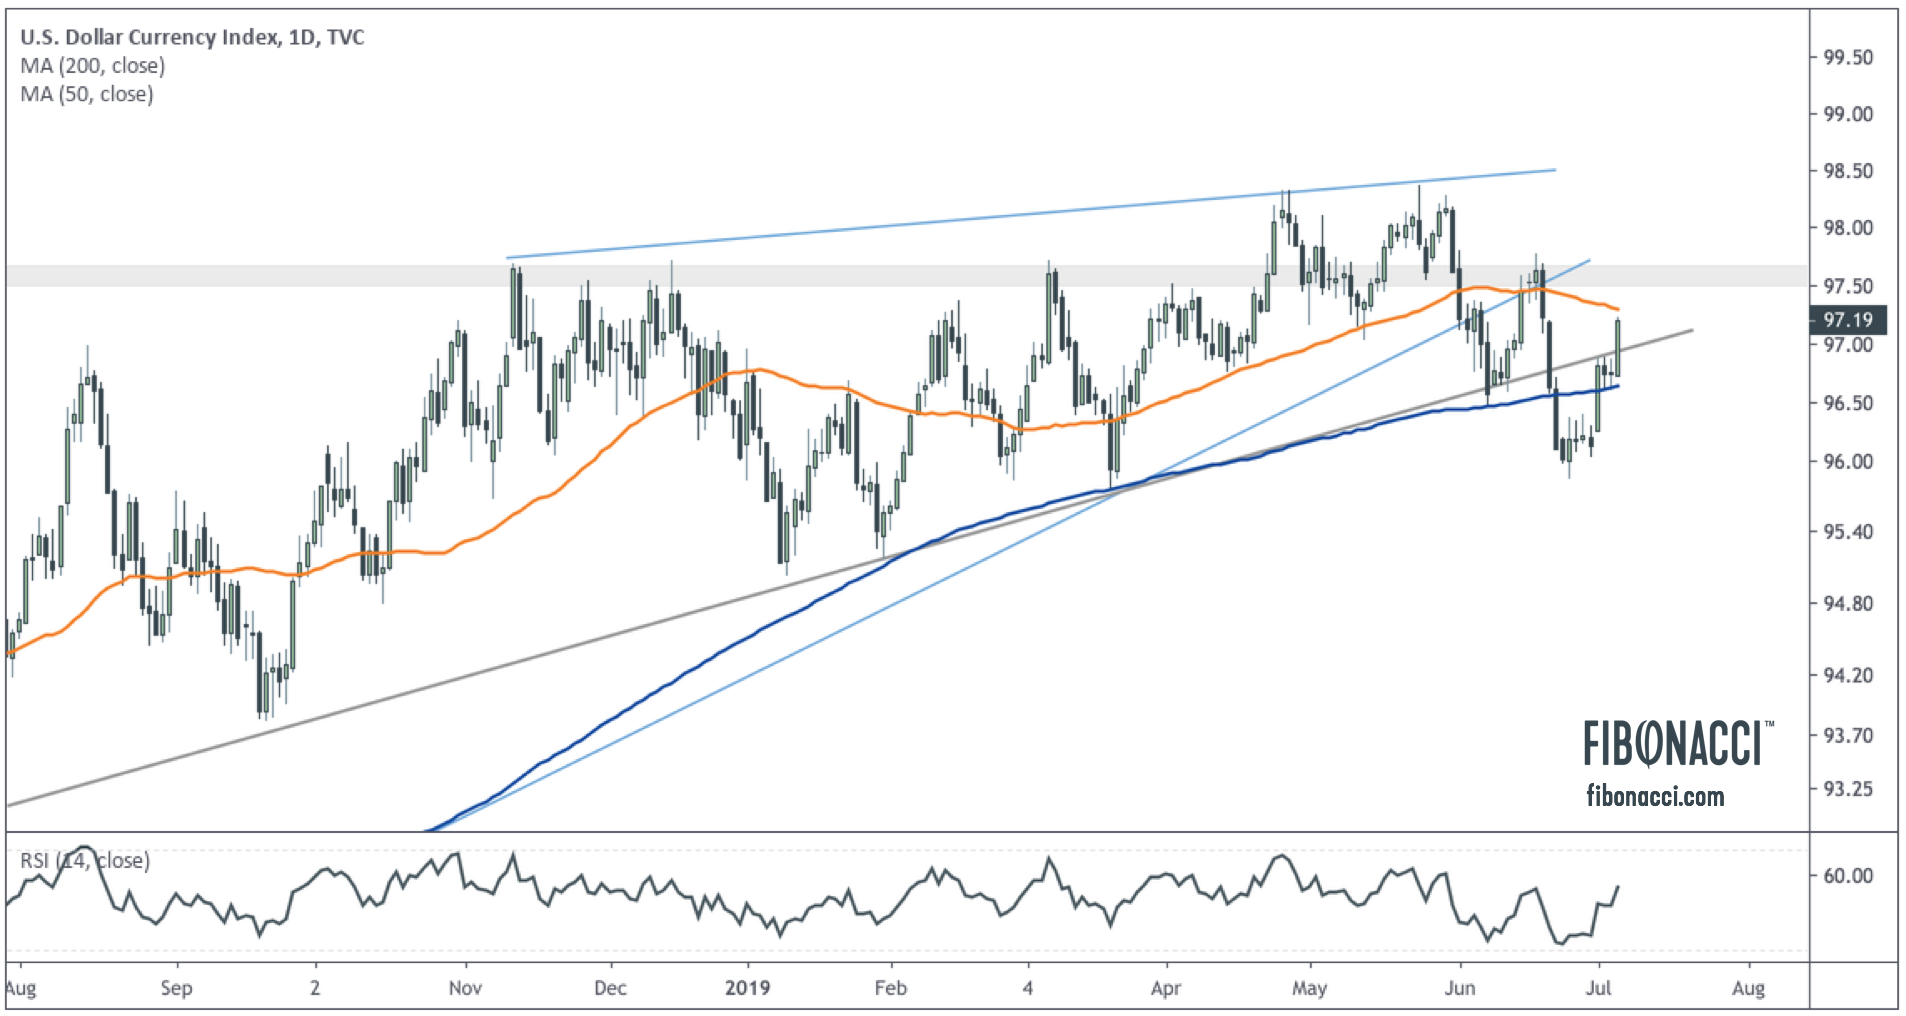
Interest Rate Cuts In Question?
The robust jobs report (224,000 new jobs vs. 160,000 projected) immediately changed the narrative of forthcoming Fed rate cuts, which had been the wind beneath the sales of the recent bull action in gold and bonds, and the weight pushing the dollar lower. The Bloomberg article referenced above summed it up: “Though the economy still faces trade tensions and below-target inflation, signs that economic growth remains intact may challenge calls for the Fed to cut rates this month — especially those for a half-point reduction.” (more…)
 Gold Entering Seasonally Strong Period At 6-Year Highs
The gold price close will be significant today, as gold will print end of day, end of week, end of month, and end of quarter closing prices. Gold bulls really want to see a close above $1400 (the 2014 peak). If gold holds here, the next target is a weekly close above $1435 (the high from the 2013 dead cat bounce), which should drive further buying activity into the gold market. A strong close today will be significant. (more…)

Gold Bugs Return from Exile
The long suffering (and diminishing) army of gold bugs, distraught over gold’s underperformance in the wake of asset inflation, government spending, and historically low (sometimes negative) interest rates over the last seven years, received a resounding message of hope yesterday when gold broke through long term resistance to top tick at 1397.70. Silver also broke through near term resistance of $15.15, and this morning gold miners also jumped higher and confirmed the breakout and retest of the long term down trend line from the 2011 highs. It all seems to be working at the moment for the precious metals sector. Let’s look at the charts. (more…)
Gold hits $1362 in Overnight Trading
The long term daily chart above highlights two potential falling (slightly) resistance lines from the peaks of the last six years. These lines are represented in black and red. Of particular note is how gold has reacted to these lines in the last few weeks – honoring both to the tick. This trading action is more evident on the 4 hr chart (below). (more…)
Testing Resistance
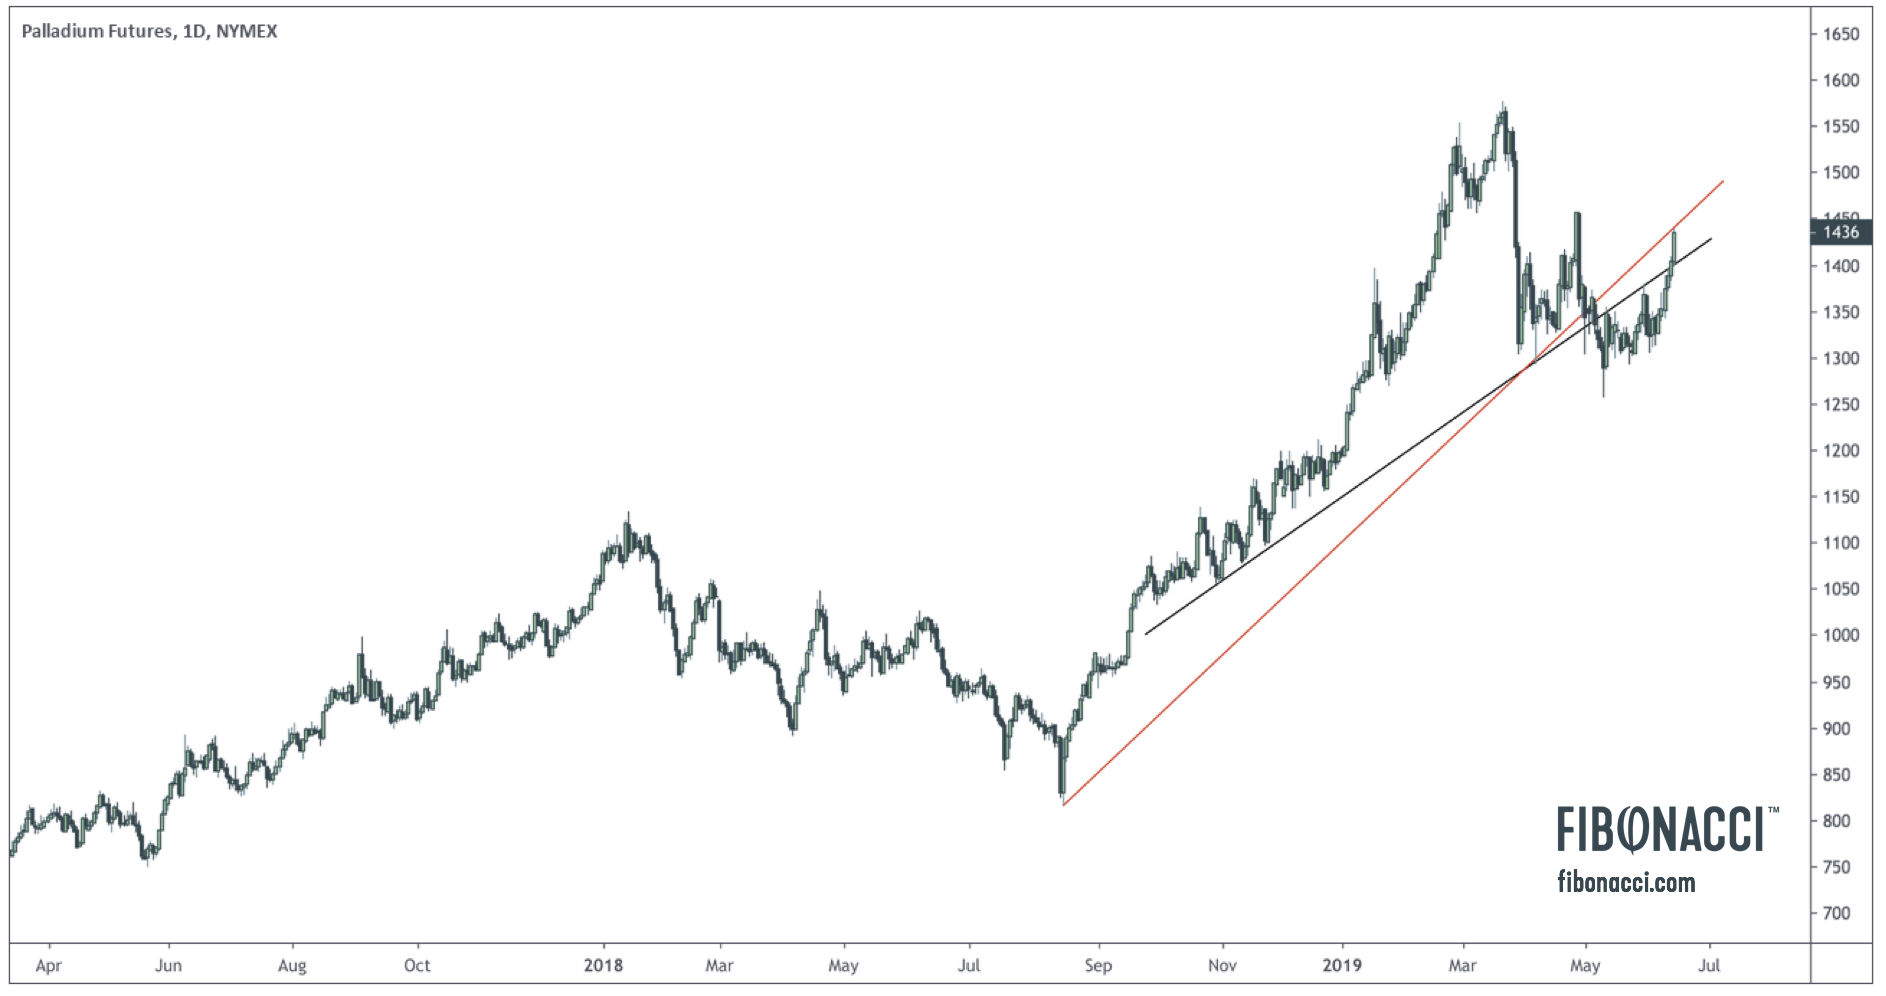
The palladium price broke up from its first test of resistance (blue trend line) and is now in the process of testing its second resistance line (red trend line). This action comes on the heels of a successful test of the 61.8% Fibonacci retracement from the August lows to the March peak, as shown in the chart below. (more…)

Gold looks bullish; Platinum, not so much
Here is a quick snapshot of the metals sector. The silver chart above is constructive, as silver broke out of a falling wedge and confirmed the bullish action in gold. It also successfully hit its initial target of $15.15-$15.20. The support levels to watch now are $14.30-$14.50, where silver may retest falling wedge support (formerly resistance) and the trend line from the August lows. A break above $15.20 should target a move to $16.20. (more…)
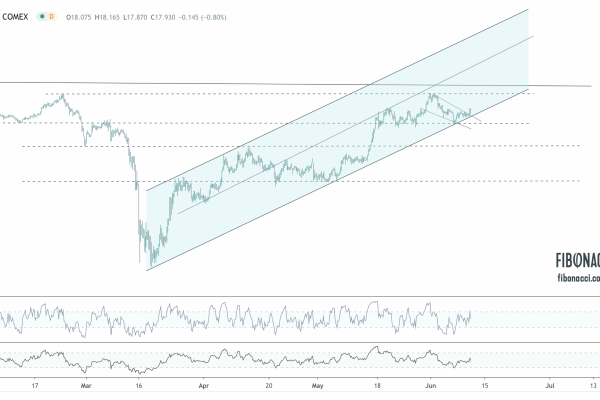
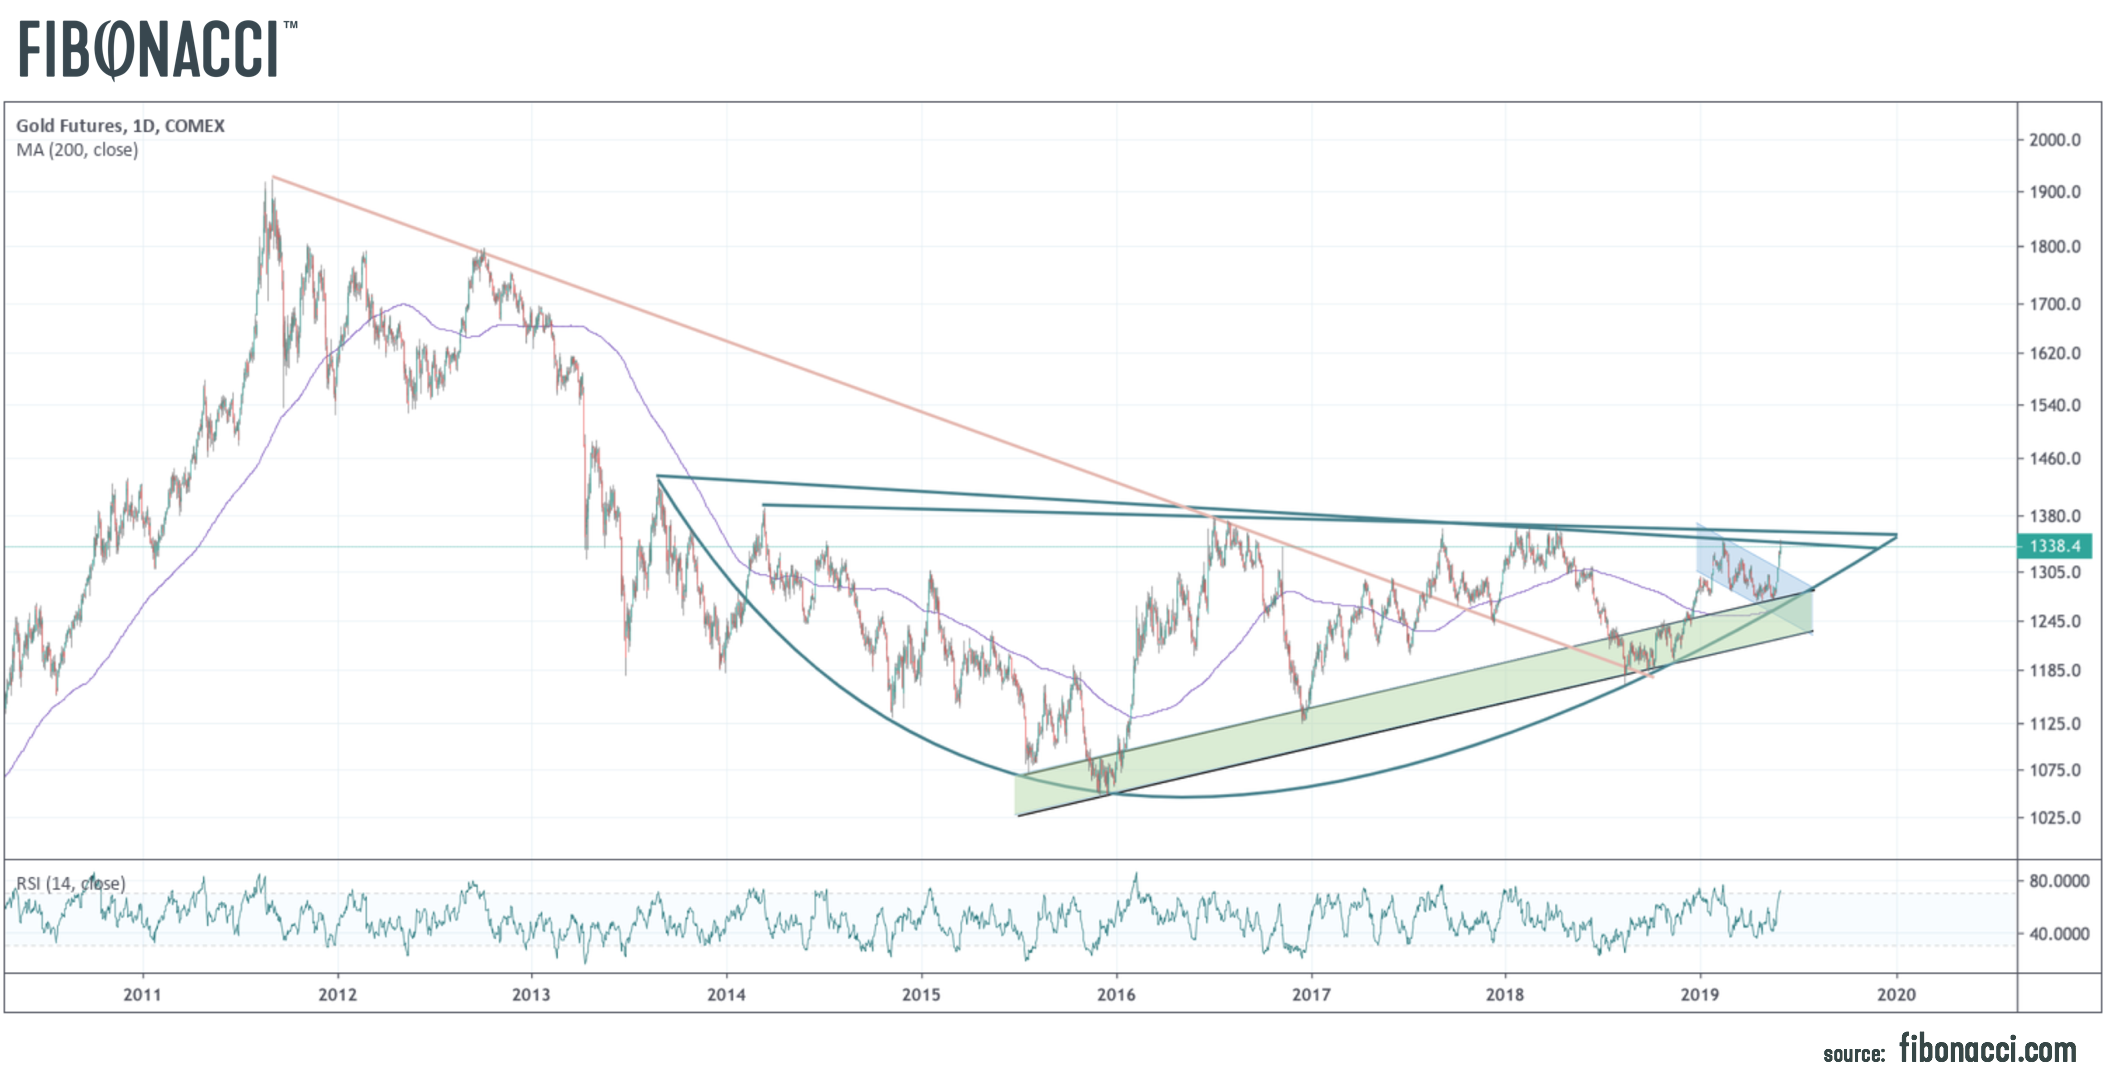 Gold retested $1350 in overnight trading, extending this current move more than $84 in the last couple of months. The chart above is admittedly busier than I generally like, but so much is happening technically with the gold price.
Gold successfully retested falling support from the 2011 peak (red line) at $1180 in late-2018. This coincided with a successful retest of rising support from the 2015 low. Gold is now meeting resistance from prior peaks between 1350-1370 during every attempt over the last 6 years to break out. (more…)
The precious metals sector has continued the momentum it closed with in May. Gold and silver, in particular have been surging this first trading day in June. Let’s take a look at the technicals.
Gold has moved from a bottom at 1167 last July to a peak at 1350 in February. Beginning in February, volatility began narrowing and gold has been mired in a falling wedge pattern. According to Bulkowski (2010), 92% of falling wedge patterns break to the upside, and of those that break, 90% reach the upside target which is measured as the distance from the breakout move to peak, added to the recent breakout. I see the original break as $1238, so in this case, that would set an upside objective at $1400-$1420. (more…)