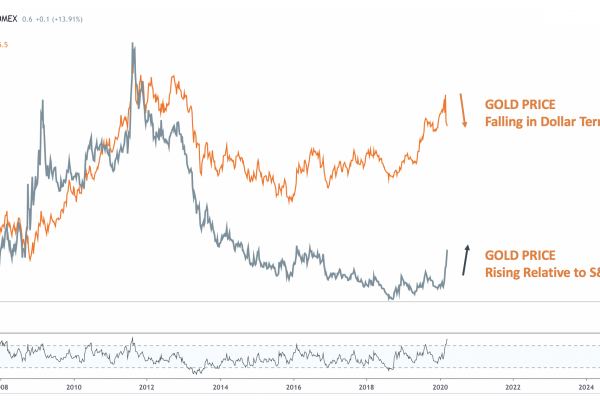
During this past week ending May 31st, 2019, oil sold off sharply, closing the week down almost $6 to $53.37, while gold rallied to close the week at $1305.50. I like to monitor the price of oil in gold terms, and to do that I use 100 barrels of oil as the numerator and the price of one ounce of gold as the denominator.
This ratio has been in a downtrend channel for a decade, with a countertrend move beginning in 2016 and failing recently during the oil sell-off last fall, which led to the breakdown of the blue channel. Oil has since tried to retest that support line through the first part of this year, but failed the retest last week. This failure is bearish, meaning that it indicates a lower ratio going forward, which should be strong for gold and weak for oil.
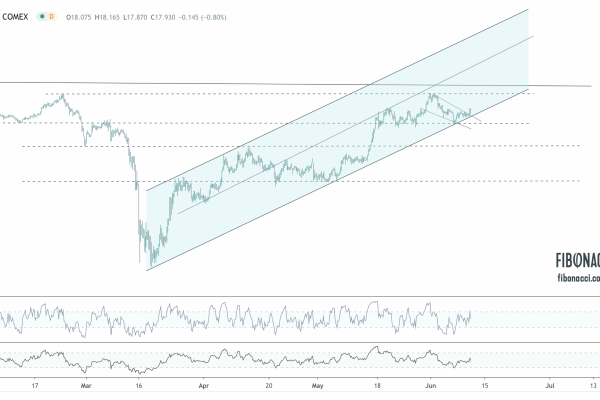
Following weeks of low volatility, where the CBOE Gold Volatility Index fell to a decade low of 8.75, gold rallied $15 per ounce today to close at $1284. Simultaneously, the US dollar broke above heavy resistance (briefly) at 98. As the dollar goes, so go the metals.
Gold has been forming a long, rounded bottom since 2013, and the chart looks constructive. The bull case for gold technically is that the price has remained above the 200 day moving average for the entirety of 2019, and the 200 DMA is now turning up. Gold also pushed into overbought territory on the Relative Strength Index (RSI) earlier this year, and as not oversold, which indicates that gold still has positive momentum. (more…)