Gold looks bullish; Platinum, not so much
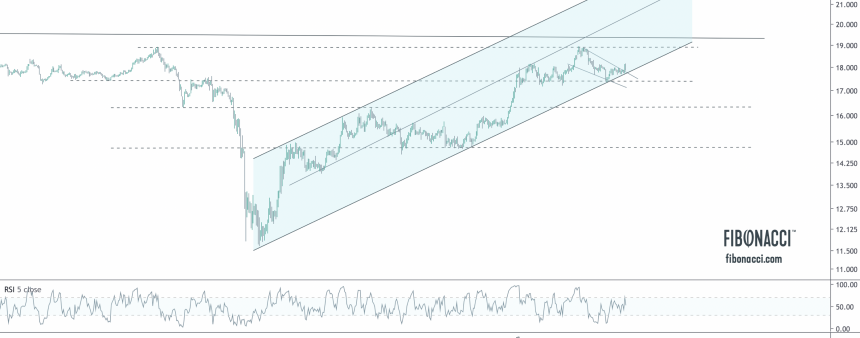
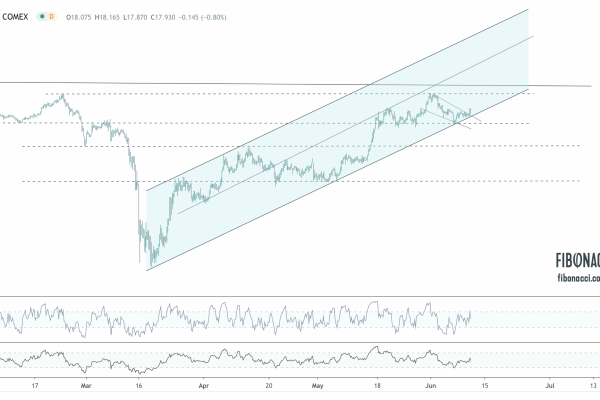
Here is a quick snapshot of the metals sector. The silver chart above is constructive, as silver broke out of a falling wedge and confirmed the bullish action in gold. It also successfully hit its initial target of $15.15-$15.20. The support levels to watch now are $14.30-$14.50, where silver may retest falling wedge support (formerly resistance) and the trend line from the August lows. A break above $15.20 should target a move to $16.20.

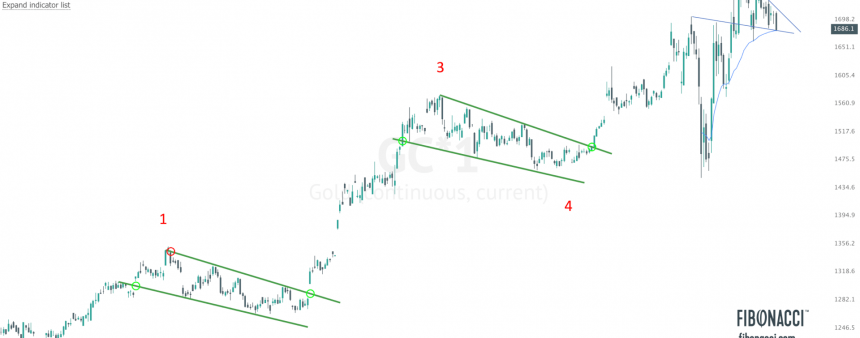
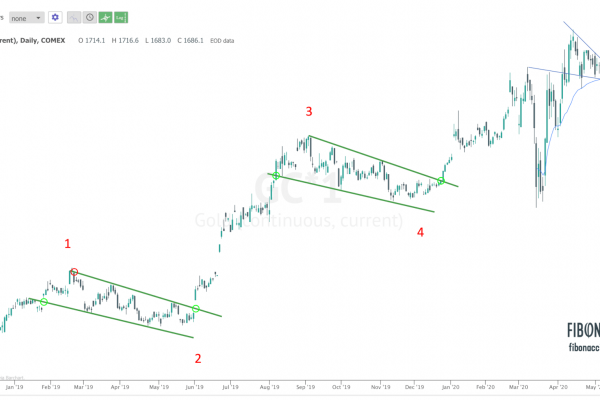
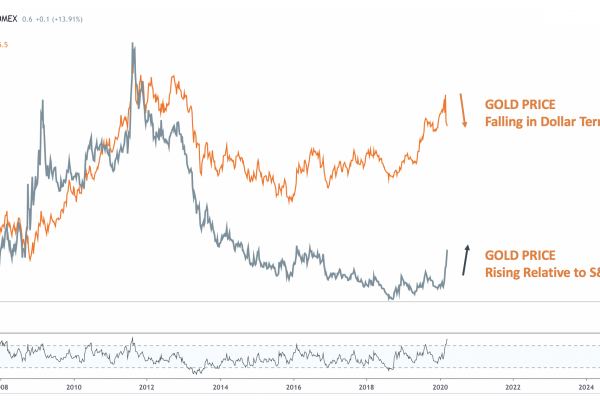
Gold remains in a solid uptrend. The three month bull flag consolidation and subsequent breakout in gold from the August low to the February peak suggests a measured move to $1480 if/when gold breaks through long term overhead resistance ~$1360-65. On the downside, $1280-$1290 needs to hold to prevent a breakdown.

The platinum chart is ugly. Platinum simply has no momentum and must fight through a series of falling trend lines to show any sign of life. Until platinum breaks $1000/oz, it will just be trend-less and choppy, and if $755 fails to hold on the downside – look out below.

The palladium chart is attempting a third retest of resistance (prior support). If it can manage to break through above that resistance line, it would send a very bullish signal. Personally, the action from the low to this retest looks me to be a bear flag with further downside to come.

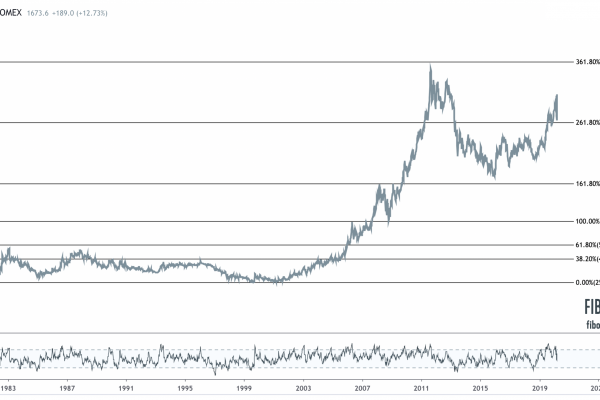
Lastly, copper is at a VERY critical juncture here testing long term support. The chart above is the 30-yr log chart, while the chart below is the 3-yr arithmetic chart.

Copper tends to be a leading indicator and indicative of global growth prospects. Where the copper price moves from here will send a key signal.
Related Posts