Which Asset Class Will Outperform?
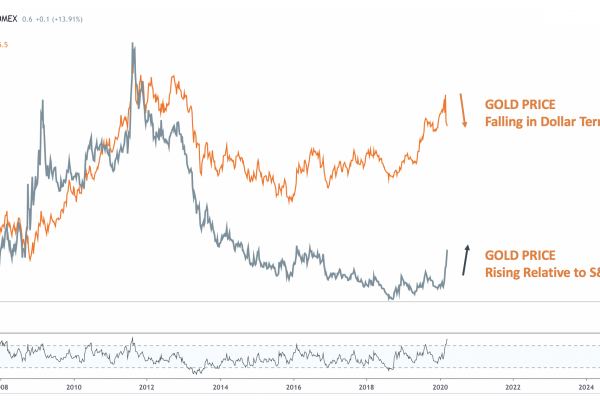
In advance of tomorrow’s Fed meeting and decision on interest rates, I am closely monitoring the S&P500 priced in gold. The S&P500 has broken out to all-time highs and has successfully retested the breakout, while gold has retreated ~$100 from its highs in August, either setting up a washout to a new near term bottom (possibly backtesting the entire breakout from $1380), or preparing for a rally to retest the $1580 level after a multi-month bull flag.


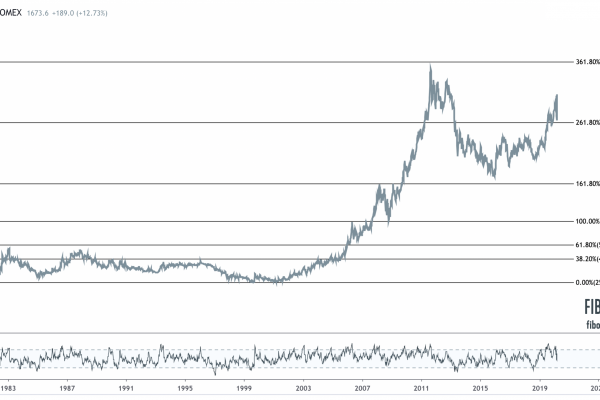
The ratio between the two sits at an important level. After peaking at 5.5 in late 1999 and 2001 (double top), the ratio fell for the next decade, through the financial crisis, bottoming at just 0.5 in 2011. Since then, the rally in equities and the eventual decline in precious metals pushed the ratio back up to the 38.2% Fibonacci retracement at 2.5, forming a nine year channel in the process, which recently broke in August (according to the likelier of two possible channel formations), and pulled back to the breakdown level in recent weeks. Based on this chart pattern, I think near term gold outperformance is a higher probability outcome.

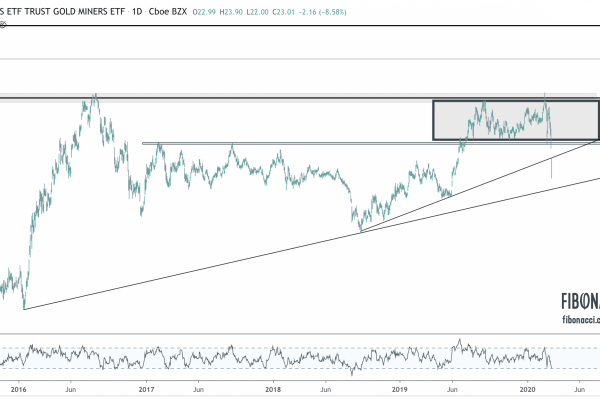
However, we need to respect an alternate chart drawing. Instead of using the 2009 low as an indication for rising resistance in the channel, it is possible to use the secondary low in 2009, which would pull recent action back into to the channel and suggest that the ratio has not yet broken down. In that case, I think near term S&P outperformance is a higher probability outcome.

Tomorrow’s fed announcement should help to clarify the picture.
Related Posts